360 Automotive
A comprehensive and affordable Business Intelligence reporting solution for automotive groups and dealers.

Automotive dealership data is growing fast. Every system you implement has it’s own set of analytical data. Everything from your DMS, manufacturers composite, CRM right through to ancillary solutions for ad management, video demonstrations and many others. Each can reveal great insights into your operational performance. But the sum is far greater than the components. Bringing all your data together can deliver real Business Intelligence.
At 360Analytics, we recognise that automotive dealers need clear, effective and consistent periodic reporting that won’t break the bank. That’s why we built 360Automotive and made it as comprehensive, effortless and affordable as possible.
360Automotive - £95 per month per dealer*
360Automotive is a standard reporting package that includes the following:
Your data
– each month simply send us your data files in a standard consistent format (we don’t mind what format as long as it’s the same every month). Our standard package assumes you will send 4 data files: an output from your manufacturers composite report or your Dealer Management System; a CRM or contact management system; a web analytics system and a social media profile. Need to add more data? Add additional data sources for just £18.50 per month per dealer.
Data management
– We begin by preparing each file ensuring that all of the data is in alignment with previous data; any new control data is represented in the control files and that there is no obviously erroneous or corrupt information. We then consolidate and incorporate the data, along with all historical data, into a data cube before running the first visualisation build.
Your reports –
we have included 3 reports as standard: A sales activity report showing actuals and 13, 25 or 37 month history; A comparative differential scorecard that compares each dealers performance to the group average and determines a rank for each element as well as an overall score; A social media report that shows just how much your customers and prospects are interacting with you on social media. Each of the reports contain the data of your choice. You know what data works for you and what doesn’t so we will work with you to identify the data elements that you value the most.


Sales Activity Report
– This report shows actuals across a range of data including digital and social, showroom activity and sales and deliveries for new and used. Each element is shown relative to the same month last year however we can also show it relative to a rolling 12 average or even an average of the same month over a number of years. The trend graphs give a clear view across a period of time and you can choose to make that either 13, 25 or 37 months.
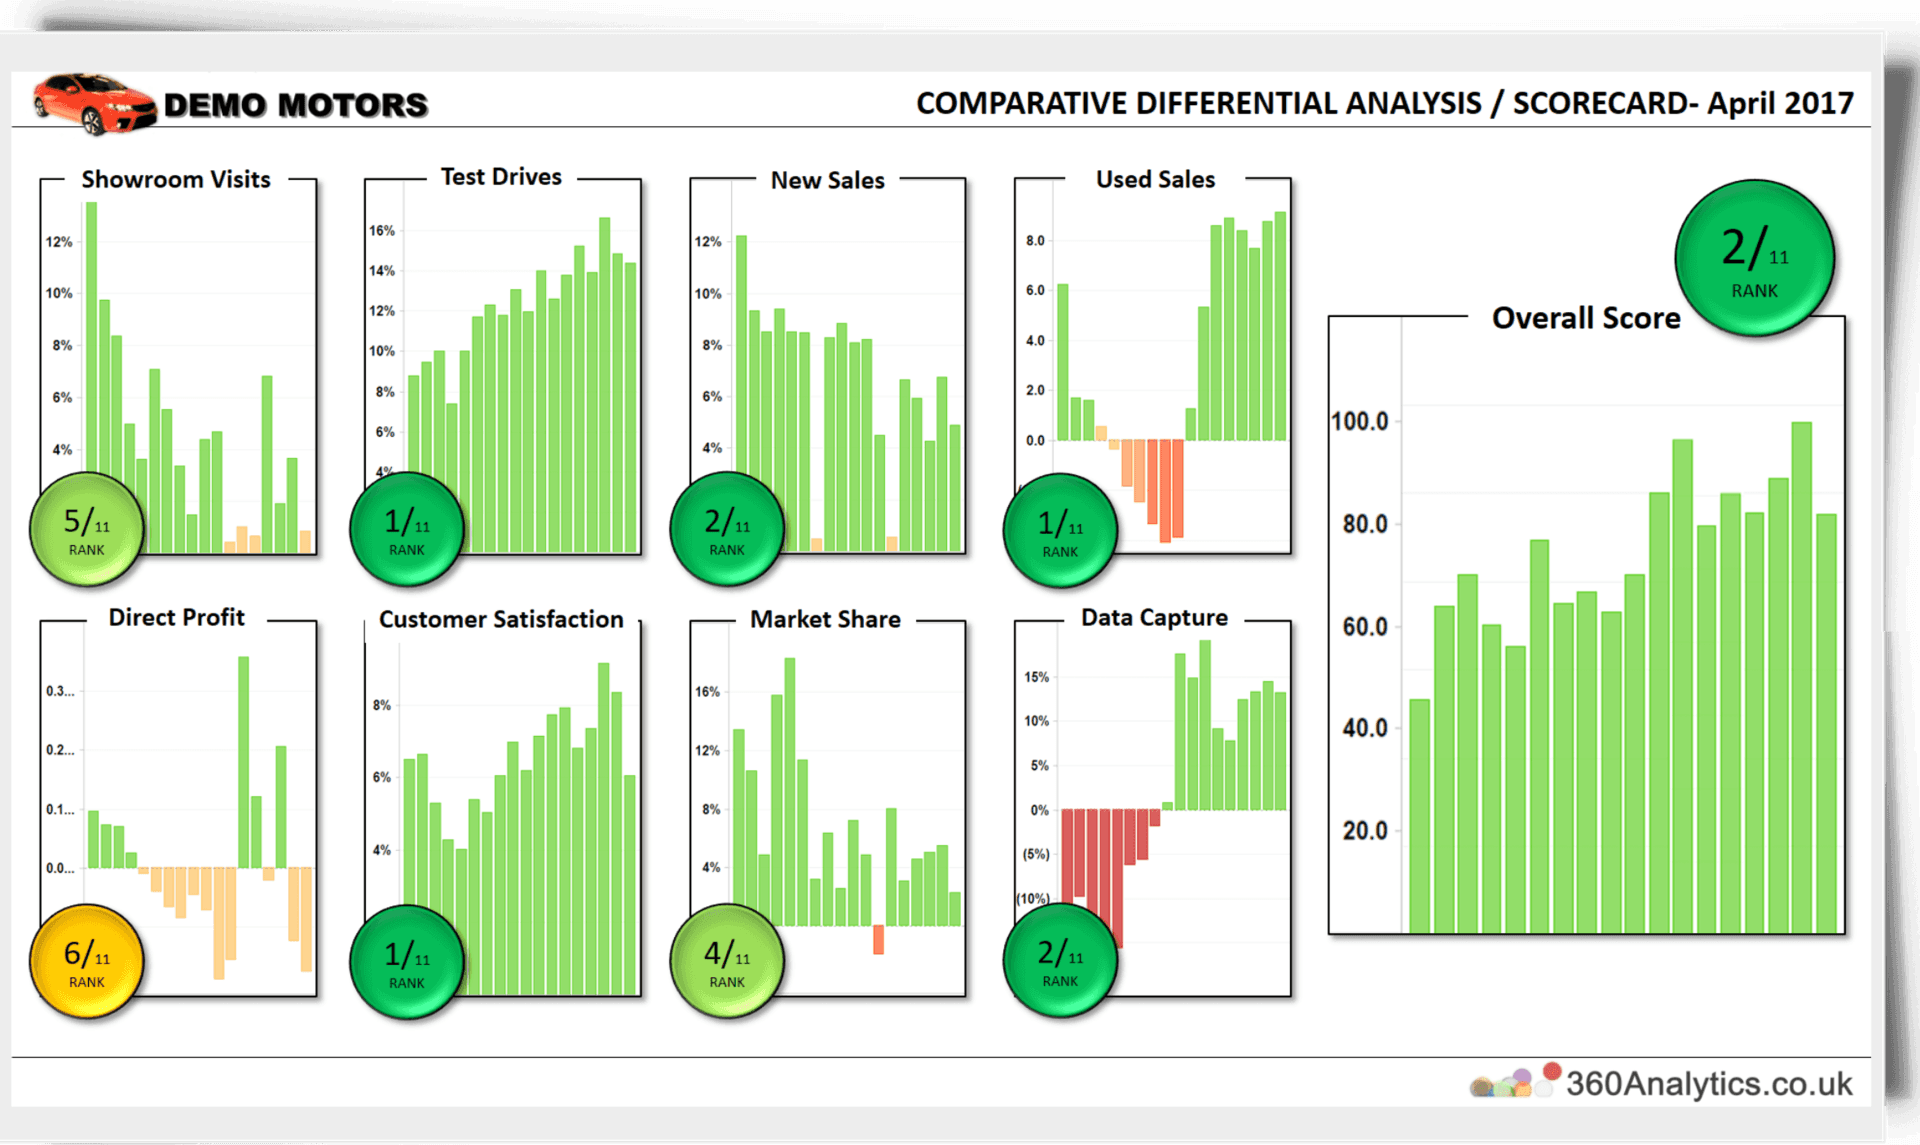
Comparative Differential Analysis / Scorecard– This report shows how the dealer compares to the average of other dealers within the group across a range of data and includes a rank for each data element. Comparatives are important. As an example, you might see a sharp fall in showroom visits. Without knowing how that compares to other dealers it is difficult to know whether it is because of the roadworks outside or just because less showroom visits are being made generally.
Ranking and comparatives can be made to the group as a whole or to a subset of dealers defined by geography or manufacturer franchise while the trend graphs give a clear view across a period of time showing whether or not you are improving against the average.
Social Media Report – This report gives you insight into just how much your customers love you and how good you are at interacting with your potential customers on Facebook, Twitter, Youtube, Google+, LinkedIn and Instagram. It will also tell you at what time of day your customers are most active and therefore when you need to be most responsive. Don’t have social media statistics? No problem, we can source all of your analytical data directly from the social media sites. We include Facebook analytics for one profile for free in our standard package. Additional profiles across all other social media sites are charged at £18.50 per month plus VAT.
Hand made in the UK
– All of your reports are produced by real people in an office in Windsor. Which means that your valuable data isn’t going to be shipped half way around the world. It also means that your reports will look sensible and accurate.
*Caveats - There’s always a catch. We have worked hard to keep it as simple as possible however our pricing does have some dependencies.
- There is a setup and design fee of £245+VAT per dealer.
- The price of £95 per month is for a minimum of 5 dealers within a dealer group who all use the same data sources and will have the same report format.
- Billing is quarterly in advance.
- Group or other level reporting is charged at £95 per month per level.
- All prices exclude VAT
Call us on 07484 135686 or email info@360analytics.co.uk for more information.
